
A flexible platform that combines dynamic weighing, structural monitoring and operational data in a single interface.
iWIM develops not only the hardware, but the entire ecosystem needed to capture, process, visualize, export, and understand data.
Since the inception of iWIM, software development has been a fundamental part of our systems. For us, it is not enough for a solution to capture data correctly: it is equally important that this information is transmitted, organized and displayed in a clear, logical and immediately understandable way.
To meet these needs, iWIM has internally developed a software platform accessible via a web interface, which can be used from different devices and adaptable to the operational needs of each customer. The system also allows data to be exported and integrated into databases, management platforms and third-party software.
With the introduction of GRIFFON, the fiber optic structural monitoring system integrated with BISONTE, the volume and complexity of the information available has increased significantly. In fact, in addition to the data relating to the vehicles, there are those concerning the real response of the infrastructure: deformations, inclinations, vibrations, displacements, temperature and other structural parameters.
The synchronisation between the two systems makes it possible to associate each vehicular transit with the response recorded by the deck at the same time, making visible the cause-effect relationship between the traffic load and the behaviour of the work.
For this reason, in the last year iWIM has carried out a major update of its platform, expanding the interface dedicated to dynamic weighing software and introducing new dashboards for structural monitoring. The goal is to maintain a simple and immediate reading even when the system handles large amounts of data from different sources.
Customers who have a maintenance contract can also receive continuous updates, new features, upgrades and dedicated customizations, developed according to the characteristics of the project and the operational processes of the individual operator.
Updated interface of BISON dynamic weighing software
All the data of each transit in a clear and immediate view
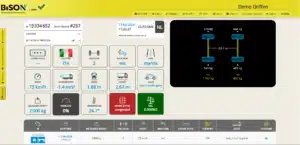
One of the main updates concerns the real-time dashboard, designed to represent each vehicular transit through an intuitive combination of tiles, icons, indicators and graphic information.
The user can immediately consult:
- vehicle identification, date and time of transit;
- Country or nationality associated with the vehicle;
- number and configuration of axes;
- total weight measured by the system;
- weight measured on individual axles or groups of axles;
- vehicle speed and acceleration;
- direction of travel and lane used;
- vehicle size and classification;
- overload percentage and transit outcome;
- traffic status, any anomalies and ESAL value
The information is organized in such a way as to offer a quick reading even during real-time operational control. The interface can be used by both technical users and operators who do not have specialized skills in the field of dynamic weighing.
The dashboard therefore makes it easier to check what is happening on the road, identify overloaded vehicles and quickly access the information necessary for traffic control and infrastructure management.
The screen shows the real-time detection of a light vehicle, with the main parameters relating to speed, weight, number of axles, direction and transit outcome.

More detailed and accurate data for each vehicle
The detail view of the vehicle has been further improved.
By selecting a transit, the user can open a dedicated window containing the complete configuration of the axes, the distances between the axes and the measured load on each axis or group of axes.
This function allows you to understand not only the total weight of the vehicle, but also the way in which the load is distributed along its structure.
The visualization is particularly useful for:
- heavy vehicles;
- vehicles with complex configurations;
- exceptional transport;
- unbalanced loads;
- transits with overload conditions;
- Analyses following anomalous events.
This allows the operator to quickly switch between the general traffic view and the detailed analysis of a specific vehicle.
More detailed monitoring of heavy and exceptional vehicles

Detailed analysis of axle loads: The pop-up view highlights an 8-axle vehicle, showing the loads on the individual axles, total weights and overload indicators.
The graphic representation of the vehicle configuration makes it possible to immediately identify any load concentrations and to assess more precisely the possible impact of transit on the pavement or infrastructure.
Real-time analysis of traffic intensity and ESAL impact
Heavy traffic data to protect pavement and infrastructure
The new interface allows you to view in real time the intensity of traffic, the distribution of vehicles between lanes and directions, the average speed, the presence of slowdowns and the ESAL value associated with transits. This indicator makes it possible to transform the vehicular loads detected into an equivalent value useful for understanding how much traffic, especially heavy traffic, affects the pavement and infrastructure over time.
By combining traffic data, vehicle classification, measured weights and ESAL, the operator can adapt their operational strategy more quickly. In the presence of congestion, an increase in heavy vehicles, high values of equivalent load or abnormal conditions, it is possible to intervene on the regulation of flows, signals, alternative routes and maintenance planning, based on real and up-to-date data.
View the complete history of recorded transits

The platform allows you to consult all the previously recorded transits through an orderly and easily searchable table.
You can:
- apply filters;
- sort the results;
- search for a specific transit;
- compare different periods;
- identify vehicles or anomalous events;
- export the data for further processing.
Information can be exported in a variety of formats, including CSV, HTML, and XLSX, making it easy to integrate with administrative tasks, internal reporting, control systems, or external platforms.
The tabular view presents the recorded transits through searchable fields such as identification, date and time, weight, number of axles, vehicle class, direction, speed, detection result and any error code.
This function allows the customer to use the software not only for real-time control, but also as a structured archive of the information collected during the entire operating period.
Vehicular transits organized in customized statistical reports
The system integrates a section dedicated to statistical reporting, through which the collected data can be transformed into graphs, tables and synthetic indicators.
The manager can get a complete picture of the situation over a given time interval, analyzing, for example:
- total number of transits;
- distribution of vehicle classes;
- incidence of heavy vehicles;
- trend of overloads;
- total weight of traffic;
- distribution of transits by lane or direction;
- changes in traffic over time.

The reports can be customized according to the customer's needs and the indicators considered most important for network management.
The report page summarizes the traffic composition through graphs, tables and the total number of vehicles registered in the selected period.
Reporting makes it possible to transform continuous monitoring into technical and management documentation, strengthening the traceability of decisions and offering concrete support for the planning of interventions.
GRIFFON interface for structural monitoring
Data on the infrastructure and its response to traffic loads
The GRIFFON dashboard is dedicated to visualizing the behavior of the infrastructure under the effect of real vehicles in transit.
The interface combines:
- graphic representation of the bridge or road section;
- location of installed sensors;
- identification of the vehicle in transit;
- total weight and configuration of the axles;
- speed and class of the vehicle;
- Structural Measures Charts;
- temporal comparison between the load applied and the response of the work.
GRIFFON integrates a network of optical sensors installed on the structure with a software platform dedicated to data acquisition, visualization and analysis.
Depending on the design configuration, the system can measure deformations, tilts, vibrations, displacements, temperature, and other significant parameters to evaluate the behavior of the work.

The time synchronization between BISON and GRIFONE allows you to select a specific vehicle and analyze the corresponding structural response.
The dashboard links vehicle weight data to the responses recorded by the sensors, giving you a clear view of the infrastructure behavior under traffic load.
This is particularly useful for:
- bridges and viaducts subject to heavy traffic;
- strategic infrastructures;
- works with incomplete historical documentation;
- port accesses and logistics axes;
- structures for which continuity of service is essential;
- predictive maintenance projects;
- validation and updating of numerical models and digital twins.
Fiber optic technology also offers important application advantages. The sensors are passive, do not require power supply at the measuring point and are immune to electromagnetic interference. The network can be designed in a modular way and expanded over time according to the criticality of the work and the objectives of the operator.

GRIFFON’s interface allows you to view the main parameters of the structural behavior of the infrastructure in a single screen, with clear graphs updated over time. In particular, the system collects and represents data from strain gauges, inclinometers, deck height sensors and temperature, offering the operator an immediate reading of the evolution of the work under the effect of loads and environmental conditions. This data organization makes it easier to spot variations, anomalies, and trends, supporting continuous monitoring and a more informed assessment of the state of the infrastructure.
BISON and GRIFFON offer a complete ecosystem that integrates dynamic weighing, traffic analysis and structural monitoring in a single intuitive, flexible and customizable platform.
The data are clearly organized, can be consulted in real time and easily integrated with external systems, to transform complex measurements into information that is truly useful for infrastructure management. To discover all the features of the software and evaluate how to adapt it to the needs of your project, you can request a dedicated demonstration.

Intelligent structural monitoring: an integrated view between traffic loads and infrastructure response
Integrated software for monitoring traffic and health of infrastructures with BISON and GRIFFON

Dynamic Weighing Basics: The Fundamentals of Weigh-in-Motion

The Dynamic Weighing System for Construction Sites – Low Speed WIM

INTEGRATION OF STRUCTURAL MONITORING AND DYNAMIC WEIGHING WITH IWIM “GRIFFON” CASE STUDY OF BRESCIA
